 12/12
12/12
Heat Mapping
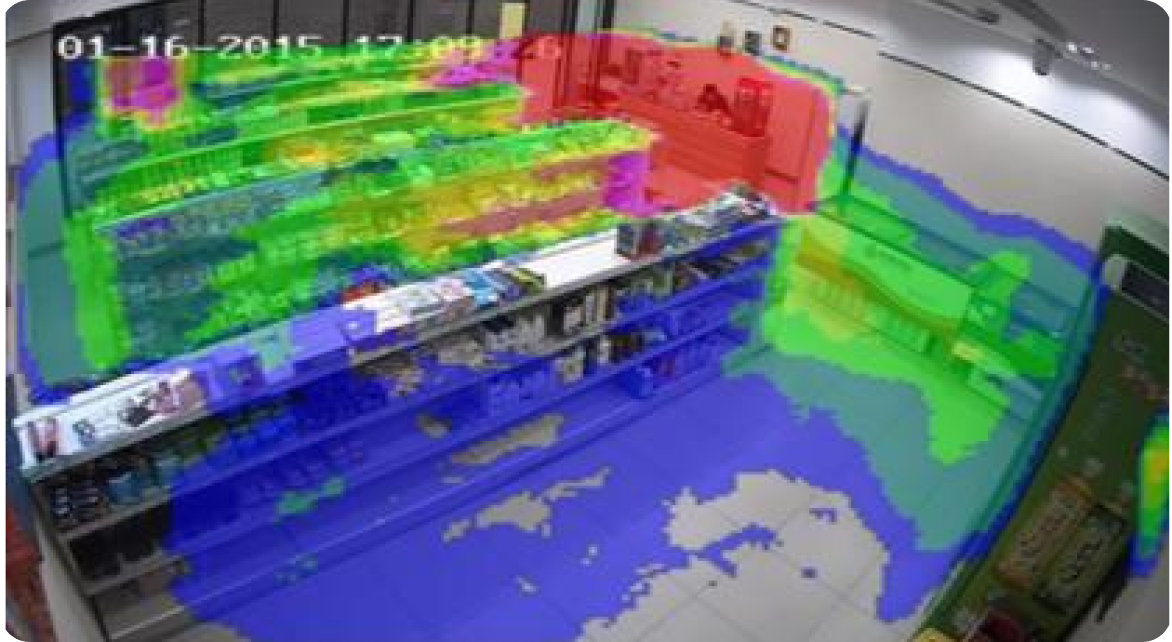
The Heat Mapping feature provides a graphical representation of customer motion and dwell time in a defined area over a period of time. Data can be represented in two ways:
- An overlay of a spectrum of colors on the video image of the area, with red indicating the highest trafficked areas and blue the lowest trafficked areas
- A 2-dimensional graph
Features and Benefits
- Easy setup to create up to eight virtual regions within the camera’s field of view
- The Arming Schedule allows you to set up a schedule for when Heat Mapping is enabled
- Easily configure Heat Mapping parameters to filter map data, including:
- Detection Sensitivity – Determines the sensitivity of the camera to identify a target
- Background Update Rate – Adjusts the rate at which a new scene replaces the previous scene
- Scene Change Level – Sets the level at which the camera responds to movement, such as a swaying curtain
- Minimum Target Size – Adjusts the size of the object the camera identifies as a target, to prevent false alarms and/or event triggers
*See product slicks for analytics supported by specific models
Recommended Applications:
- Bars
- Big Box Stores
- Boutique Retail Stores
- Convenience Stores
- Grocery Stores
- Home Improvement Stores
- Hotels
- Liquor Stores
- Retail Stores
- Theme Parks
- …and more
Ideal for:
- Heat Map is ideal for applications such as:
- Identifying store hot spots, dead areas and bottlenecks
- Optimizing store performance and improving customer service
- Determining which products customers are engaging with and the resulting purchase trends, to optimize product placement and merchandising strategies
- Seeing the impact of merchandising changes on customer flow, sales, average revenue per square foot and more
